Let’s say this is the first time you’ve heard or read about Streamr Network and Streamlit; if you are already aware, then bear with me as I give a TLDR:
- Streamr Network: is a decentralized, peer-to-peer network for real-time data publishing and subscription, providing a scalable, robust, and secure platform for data exchange without reliance on a central server.
- Streamlit: is an open-source Python library for rapidly creating and deploying interactive web apps for data science and machine learning without needing web development skills.
Streamr Node Dashboard is an application built using Streamlit inspired by BrubeckScan (R.I.P.), a Streamr node and rewards monitoring dApp built and maintained by Streamr community member Adam Phi Vo. The application is built around the concept of a Streamr Node, an entity in the network that processes and stores data. We will go through the process of building this application step-by-step.
The main features of the application are:
- Fetching data from the Streamr API endpoints
- Displaying details about a specific Streamr node
- Displaying payouts and the latest claimed reward codes for a Streamr node
Table of Contents
Dependencies
The dependencies for this project are pretty standard for a Python data app:
concurrent.futures– for running multiple requests concurrentlyio– for handling byte streamslogging– for logging messagesmathandre– for numerical and regular expression operations, respectivelydatetime– for handling datetime objectspytz– for handling timezone conversionsrequests– for making HTTP requestsstreamlit– for the web app frameworkPIL(Pillow) andreportlab,svglib– for handling images and SVGconfig – is a custom module containing configuration parameters (like API base URLs)
import concurrent.futures
import io
import logging
import math
import re
from datetime import datetime
from typing import Optional

import pytz
import requests
import streamlit as st
from PIL import Image
from reportlab.graphics import renderPM
from svglib.svglib import svg2rlg

import config
Streamlit App Configuration
Streamlit’s set_page_config function customizes the app’s page settings, including the title, icon, layout, initial sidebar state, and menu items.
# Streamlit page config MUST be the first Streamlit command
# used in your app, and MUST only be set once
st.set_page_config(
    page_title="Streamr BrubeckScan Dashboard App",
    page_icon=":lightning:",
    layout="wide",
    initial_sidebar_state="expanded",
    menu_items={
        'Get help': 'https://www.thedataengineerblog.com/',
        'About': "# This is a Streamlit clone version of the official Streamr BrubeckScan dashboard."
    })
Fetching Data
The fetch_data() function fetches data from a given endpoint and handles any errors that might occur:
def fetch_data(endpoint: str) -> dict:
    """
    Fetch data from a given endpoint.

    Args:
        endpoint: The URL of the endpoint to fetch data from.

    Returns:
        The JSON response from the endpoint is a dictionary. Returns None if the request fails.
    """
    try:
        response = requests.get(endpoint)
        response.raise_for_status()
        return response.json()
    except requests.exceptions.RequestException as e:
        logging.error(f"Request to {endpoint} failed: {e}")
        return None
The fetch_node_data function is a specialized function for fetching data about a specific Streamr node from the Streamr API:
def fetch_node_data(node_address: str) -> dict:
    """
    Fetch data for a specific Streamr node.

    Args:
        node_address: The Ethereum address of the Streamr node.

    Returns:
        The data for the Streamr node as a dictionary. Returns None if the request fails.
    """
    logging.info(f"Fetching node data for address {node_address}")
    return fetch_data(f"{config.API_BASE}/nodes/{node_address}")
The get_metrics_data function fetches metrics data for a specific Streamr node. It uses a ThreadPoolExecutor from the concurrent.futures module to fetch data from multiple endpoints concurrently; this is overkill, but why not? 😂
def get_metrics_data(node_address: str) -> dict:
    """
    Fetch metrics data for a specific Streamr node.

    Args:
        node_address: The Ethereum address of the Streamr node.

    Returns:
        The metrics data for the Streamr node as a dictionary. Returns None if any of the requests fail.
    """
    logging.info(f"Getting metrics data for node {node_address}")
    data = {
        "acc_rewards": f"{config.DATA_REWARDS_BASE}/{node_address}",
        "claimed_rewards": f"{config.CLAIMED_REWARDS_BASE}/{node_address}",
        "apr_apy": config.APR_APY_BASE
    }

    with concurrent.futures.ThreadPoolExecutor() as executor:
        future_to_url = {executor.submit(
            fetch_data, url): key for key, url in data.items()}
        results = {future_to_url[future]: future.result(
        ) for future in concurrent.futures.as_completed(future_to_url)}

    # Exclude any endpoints that failed to respond
    return {k: v for k, v in results.items() if v is not None}
Data Transformation
The functions below are handy for displaying times in a user’s local timezone. The goal is to make it easier for users to understand when the node events occurred in their timezone. We will use the functions to build the dashboard display later.
def convert_time_to_user_tz(time_str: str, user_tz: str) -> str:
    """
    Convert a time string to a given timezone and format it.

    Args:
        time_str: The time string to convert. It should be in ISO 8601 format (i.e., "YYYY-MM-DDTHH:MM:SS.sssZ").
        user_tz: The timezone to convert the time to.

    Returns:
        The time converted to the user's timezone and formatted as a string.
    """
    utc = pytz.timezone('UTC')
    user_tz = pytz.timezone(user_tz)

    # Convert the string to a datetime object
    dt = datetime.strptime(time_str, "%Y-%m-%dT%H:%M:%S.%fZ")

    # Set the timezone to UTC (since the original time is in UTC)
    dt = utc.localize(dt)

    # Convert to user selected timezone
    dt_user_tz = dt.astimezone(user_tz)

    # Format the time in the desired way (12-hour time)
    formatted_time = dt_user_tz.strftime("%I:%M:%S %p")

    return formatted_time


def convert_dt_to_user_tz(dt: datetime, user_tz: str) -> str:
    """
    Convert a datetime object to a given timezone and format it.

    Args:
        dt: The datetime object to convert. It should be naive (i.e., timezone-unaware).
        user_tz: The timezone to convert the datetime to.

    Returns:
        The datetime converted to the user's timezone and formatted as a string.
    """
    utc = pytz.timezone('UTC')
    user_tz = pytz.timezone(user_tz)

    # Set the timezone to UTC (since the original time is in UTC)
    dt = utc.localize(dt)

    # Convert to user selected timezone
    dt_user_tz = dt.astimezone(user_tz)

    # Format the datetime in the desired way (day, date, time, and timezone)
    formatted_time = dt_user_tz.strftime("%a, %d %b %Y %H:%M:%S %Z")

    return formatted_time
Display Functions
The check_status method returns a boolean status of the node. OK means the node is operational, while NO means not operational.
def check_status(status: bool) -> str:
    """
    Check the status of a Streamr node.

    Args:
        status: The status of the Streamr node.

    Returns:
        A string representing the status of the Streamr node.
    """
    return ":green[OK]" if status else ":red[NO]"
display_node_info() function shows specific metrics about the Streamr node, as shown in the image below.
def display_node_info(node_address: str, node_data: dict) -> None:
    """
    Display information about a specific Streamr node.

    Args:
        node_address: The Ethereum address of the Streamr node.
        node_data: The data for the Streamr node.

    Returns:
        None
    """
    st.divider()
    col1, col2, col3 = st.columns(3)
    col1.image(node_data['data']['node']['identiconURL'],
               caption='Node Identicon')
    col2.metric("Node Address", node_address[:4] + "...")
    col1.markdown(
        f"Status: **{check_status(node_data['data']['node']['status'])}**")
    col3.metric("Staked $DATA", node_data['data']['node']['staked'])
    col2.metric("To be Received", round(
        node_data['data']['node']['toBeReceived'], 2))
    col2.metric("Total rewards", node_data['data']['node']['rewards'])
    col3.metric("Claim Count", node_data['data']['node']['claimCount'])
    col3.metric("Percentage of received claims %", round(
        node_data['data']['node']['claimPercentage'], 2))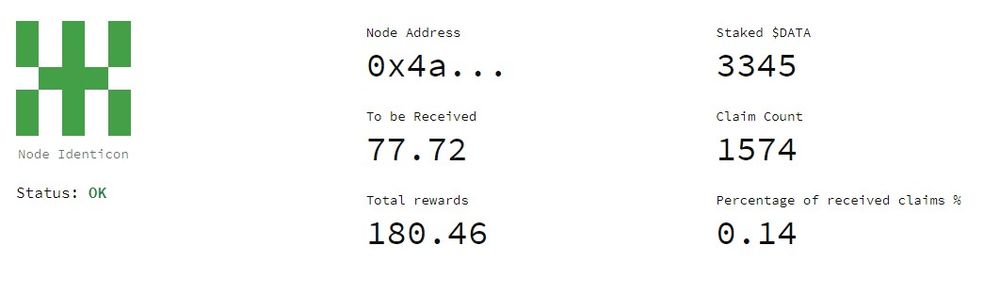
When you run a Streamr Broker node, you periodically receive reward codes at random intervals. These reward codes then verify your node’s activity and eligibility to receive rewards. Read more detailed info on Mining on Streamr.
The display_latest_codes function displays the latest reward codes received for the Streamr node.
def display_latest_codes(node_data: dict, col: st.delta_generator.DeltaGenerator) -> None:
    """
    Display the latest claimed reward codes for a Streamr node.

    Args:
        node_data: The data for the Streamr node.
        col: The Streamlit column to display the codes in.

    Returns:
        None
    """
    all_timezones = pytz.all_timezones
    selected_tz = col.selectbox(
        "Select your timezone", all_timezones, index=all_timezones.index('US/Eastern'))

    for code in node_data['data']['node']['claimedRewardCodes']:
        formatted_time = convert_time_to_user_tz(
            code['claimTime'], selected_tz)
        col.write(f"{code['id']} → {formatted_time}")
display_payouts shows the historical payouts for the node; $DATA token rewards earned by running the node.
def display_payouts(node_data: dict) -> None:
    """
    Display the payouts for a Streamr node.

    Args:
        node_data: The data for the Streamr node.

    Returns:
        None
    """
    # Create placeholders for headers
    st.divider()
    header1, header2 = st.columns(2)

    header1.header("Payouts")
    header2.header("Latest codes")

    # Create columns for the contents
    cols = st.columns([4, 2, 12])

    utc = pytz.timezone('UTC')
    payouts = node_data['data']['node']['payouts']
    payouts.reverse()
    for payout in payouts:
        # Convert the timestamp to a datetime object
        payout_time = datetime.utcfromtimestamp(int(payout['timestamp']))
        # Use convert_dt_to_user_tz() since payout_time is already a datetime object
        formatted_time = convert_dt_to_user_tz(payout_time, 'UTC')
        rounded_payout = math.ceil(float(payout['value']))

        # Use the first column for the text and the second for the SVG
        cols[0].markdown(f"{formatted_time} → {rounded_payout}")
        display_svg(cols[1], "assets/data_token.svg", width=20, height=20)

    # Display the latest codes in the third column
    display_latest_codes(node_data, cols[2])
    st.divider()
I used the display_svg function to display the Streamr SVG image beside the payout information. If you are following this tutorial step-by-step, you must have the SVG image saved in your directory under the assets/data_token.svg folder.
I used the display_svg function to display the Streamr SVG image beside the payout information. If you are following this tutorial step-by-step, you must have the SVG image saved in your directory under the assets/data_token.svg folder.
def display_svg(col: st.delta_generator.DeltaGenerator, path: str, width: Optional[int] = None, height: Optional[int] = None) -> None:
    """
    Display an SVG image in a Streamlit column.

    Args:
        col: The Streamlit column to display the image in.
        path: The path to the SVG file.
        width: The width to resize the image to. If None, the original width of the image is used.
        height: The height to resize the image to. If None, the original height of the image is used.

    Returns:
        None
    """
    # Load the SVG file and convert it to a ReportLab Drawing
    drawing = svg2rlg(path)

    # Convert the Drawing to a PIL image
    pil_image = renderPM.drawToPIL(drawing)

    # Resize the image if width and height are provided
    if width and height:
        pil_image = pil_image.resize((width, height))

    # Convert the PIL image to an IO Bytes object so Streamlit can display it
    image_stream = io.BytesIO()
    pil_image.save(image_stream, format='PNG')
    pil_image = Image.open(image_stream)

    # Display the image
col.image(pil_image, use_column_width=False)display_svg function to display the Streamr SVG image beside the payout information. If you are following this tutorial step-by-step, you must have the SVG image saved in your directory under the assets/data_token.svg folder.Final step

Time to glue everything above together:
def main() -> None:
"""
The main function of the Streamlit app. It asks the user for a Streamr node Ethereum address, fetches data for the node, and displays it.
Returns:
None
"""
st.title("⚡ Streamr BrubeckScan Dashboard App ⚡")
node_address = st.text_input(
"Enter a Streamr Node Ethereum address here", placeholder="0x4a2A3501e50759250828ACd85E7450fb55A10a69", max_chars=42)
with st.expander('Copy the address in this expander and paste above for testing 🎉'):
st.code('''0x4a2A3501e50759250828ACd85E7450fb55A10a69''')
if node_address:
logging.info(f"Processing node address {node_address}")
if re.match("^0x[a-fA-F0-9]{40}$", node_address):
node_data = fetch_node_data(node_address)
if node_data is not None and 'data' in node_data and 'node' in node_data['data']:
get_metrics_data(node_address)
display_node_info(node_address, node_data)
display_payouts(node_data)
else:
logging.error(
f"Failed to fetch data for address {node_address}. Please make sure it is a valid Streamr node address.")
st.error(
"Failed to fetch data for the given Ethereum address. Please make sure it is a valid Streamr node address.")
else:
logging.error(
f"Invalid Ethereum address: {node_address}. It should be 42 characters long (including '0x') and hexadecimal.")
st.error(
"Invalid Ethereum address. It should be 42 characters long (including '0x') and hexadecimal.")
else:
logging.warning(
"No Streamr node Ethereum address provided...")
st.warning(
"Please enter a Streamr node Ethereum address to fetch data...")
st.markdown("🔗 **Useful Links**")
st.markdown("- [Streamr Network](https://network.streamr.network/)")
st.markdown("- [Streamr Hub](https://streamr.network/core)")
st.markdown("- [Earn $DATA](https://zealy.io/c/streamteam/questboard/intro)")
st.markdown("- [Streamr Twitter](https://twitter.com/streamr)")
st.markdown(
"💡 **Remember:** Keep building and shipping for a robust decentralized data economy!")
if __name__ == '__main__':
main()Congratulations, you’ve created a stunning dashboard! 🎉
Feel free to clone the full codebase in the repo.