On the 24th of August 2021, the first software packages to run a miner-node in the Streamr Network were released. This marked the beginning of decentralization for the P2P real-time data network. A reward pool of 2,000,000 DATA was set up to incentivise miners to join the testnet.
The expectations for the turnout of nodes running in the network was estimated to be around 3,000 based on non-exclusionary preregistration. With such a size, the Brubeck Testnets would have already been larger than the biggest internally tested networks. However, the expected network size was nearly doubled before the start of the first incentivisation period. Less than two months later the peak number of nodes seen in the network exceeded 90,000 and a total of 129,886 unique nodes had been seen in the network. For the interested, you can learn about the design of the network in the Network Whitepaper.
This exploration of the Brubeck Testnet results is long, but we hope rewarding for those interested.
Table of Contents
Expectations and Actions
The Testnets were split into three distinct phases. The goal was to get in as many nodes as possible with token incentivisation to test out the software and to fix any found issues. The test network was kept open between the incentivisation periods for additional testing and real world deployment experience.
The exceeding of the expectations for the number of participants did come at a cost, as we had to add limits to the network size for the durations of Testnets 1 and 2. However, by Testnet 3 we were able to lift the restrictions and all queued up nodes were able to join the network. The peak network size was above 90,000 during Testnet 3, making the Streamr Network’s Brubeck Testnet 3 one of the largest P2P networks in history!
For Testnet 1 we prepared the framework for how the reward codes would be distributed and claimed throughout all testnets. A lightweight backend was developed to store and publish reward codes to the miner nodes. The testnet miner-nodes were equipped with a plugin that automatically subscribed to the reward streams. The nodes would attempt to claim any reward codes that they received using HTTP-requests to the miner-backend. The claim requests included latency related data out of which metrics previously included in the Network whitepaper could be calculated. Data of the network topologies was gathered based on the states of the trackers and nodes to explore the properties of the stream overlays.
A single tracker was set up for Testnet 1. The package for running the miner-nodes was released a few days before the launch of the incentivisation period, and the expectation for the number of nodes quickly exceeded. As a result, a cap of around 4000 had to be set for the number of nodes that could join the network. This significantly alleviated the pressure on the remaining centralised parts of the network and made it easier to trace and fix bugs.
In Testnet 2, the number of trackers in the network was increased to 10. Each of the trackers was assigned a new reward stream, and the miner-nodes were assigned to the streams equally. The same reward code was published to each of the streams simultaneously to ensure that the distribution of rewards remained fair. This made it possible to allow 10 times more nodes to join the network. However, new bottlenecks were found during Testnet 2 as some remaining centralised components started to buckle under the load. For example, the Network team spent much of the week-long duration of Testnet 2 alleviating the load on the server responsible for authorisation and authentication.
Although the P2P network itself was already scaling to tens of thousands of nodes, the instability caused by the centralised services lead to so much unwanted churn (nodes joining and leaving at a fast pace) that the data gathered from Testnet 2 was found poor in quality when compared to the other two periods. However, the data of Testnet 2 does have some use in worst case churn performance prediction and analysis.
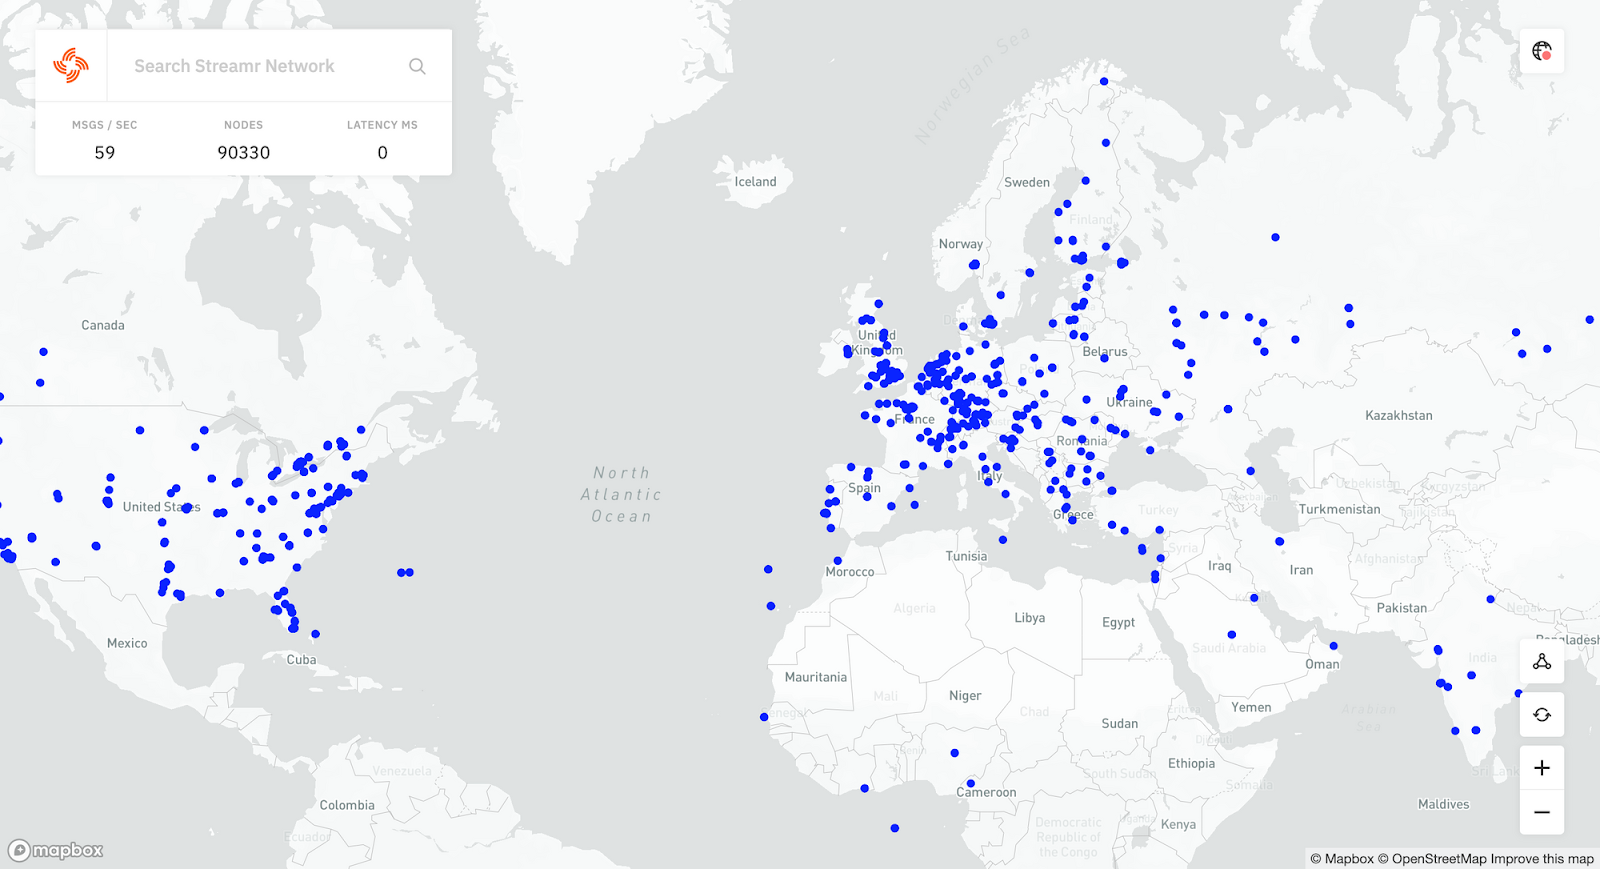
In Testnet 3 all remaining centralised bottlenecks were removed to test the limits of the P2P network’s scalability. During the final testnet period, we were finally able to let all willing participants with running nodes into the network. At the peak, there were over 90,000 unique nodes from all over the world participating in the testnet and claiming reward codes at above 99% success rates. The remaining less than 1% is almost entirely made up of the following four types of outlier nodes:
- Nodes were behind bad internet infrastructure, fixable with TURN servers
- Nodes were incorrectly configured (e.g., running multiple nodes with the same private key)
- Nodes were running an old version of the Streamr Broker node software
- Random nodes leaving and joining the network at the time of publishing
The metrics data gathered during Testnet 3 had the best quality out of all the periods and will be used for analysis in this blog.
Data acquirement and analysis
As previously described, the claim requests carried latency data, including data related to the state of the miner-node at the time of receiving the reward code. To measure the network’s latency, metrics called mean message propagation delay (MMPD) and relative delay penalty (RDP) are used. MMPD is the average time it takes for each node to receive a published message in the network. RDP describes how much longer it takes to broadcast a message over a network compared to unicasting the message to each listener individually. To measure RDP, it is necessary to measure how long it would take to individually send a direct message (unicast) from the publisher to each subscriber. The RDP is then calculated by dividing the MMPD by the mean unicast delay of the network.
To measure the MMPD of the testnets, the miner-backend kept the timestamp of when a new reward code was published in-memory. As the backend received claims for the reward it would note the timestamp of the claim-requests. The claim request would include data of the client-server latency and a random wait time used for load balancing. This data would be stored in a database alongside the timestamps. The propagation delay to a node could be calculated from these values with this formula = Recv TS – Send TS – waitTime – (clientServerLatency / 2).
On top of the latency data, a couple of other important data points were gathered. One of these was the NAT types of the nodes. An existing NPM library called nat-type-identifier was used to do this. However, during the Testnets it was found out that the library used an old version of the STUN protocol and could not yield accurate results excluding a few key types.
The final key piece of data is the reward streams’ overlay network topologies. Basically, the network topology refers to how the nodes are connected to each other. There are two useful versions of the data. First, the trackers maintain the latest state of how it has instructed all nodes in the stream overlays to form connections. This data can be easily fetched with a public HTTP-endpoint that the trackers are equipped with. The second method is to use the nodes’ views of which P2P connections they have formed. The data is very useful as it can be used to see if the nodes are able to form the target number of connections. Specifically, nodes that are consistently unable to form the target number of connections can be detected and compared to their reported NAT types. Analysing the connection counts in the network is important as the goal of the network is to form d-regular random graphs. Meaning that the nodes in the topologies should all have d connections and the connections should be selected randomly.
The topology data included the latencies for each of the P2P connections, if available. This makes it possible to estimate the expected MMPDs that should be present in the stream topologies. Dijkstra’s algorithm was used to calculate the shortest paths and distances to each node from the publisher. The algorithm can also be used to run the same computation from all nodes to all nodes to estimate the global MMPD of the network. Dijkstra’s algorithm can be used to see if the graph behaves as if it was constructed randomly. This is done by setting the latencies of the connections to a constant value before running the algorithm. If the numbers of hops in the graph are similar to known values for random graphs of similar sizes and no clusters of nodes can be found, the graph can be deemed to be randomly constructed.
Results
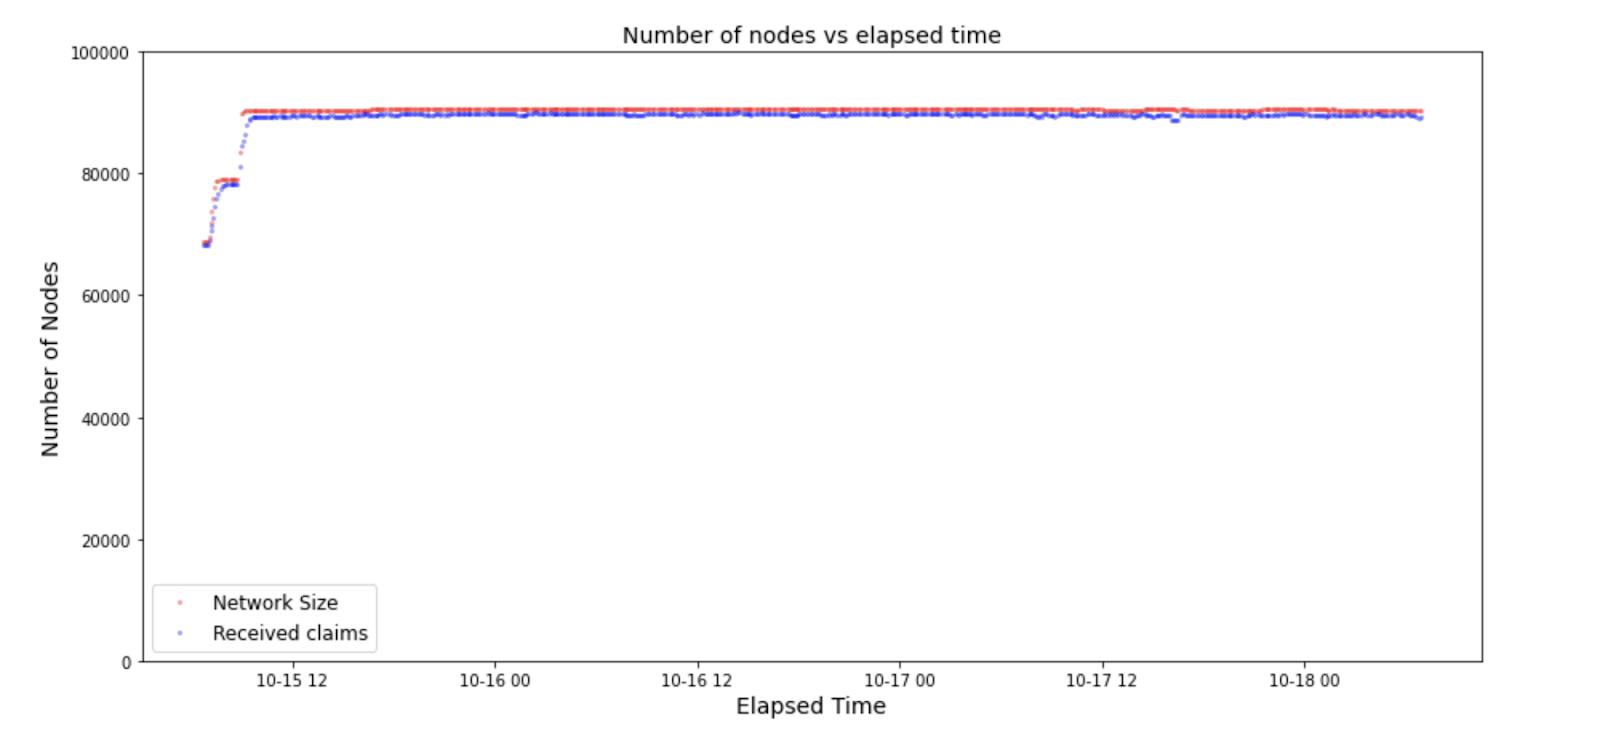
As the Brubeck Testnets were the first public deployments of the Streamr Network, the number of participating nodes and the results analysed from the data are amazing! The node counts also remained surprisingly high between the incentivization periods, as can be seen in the following figure.
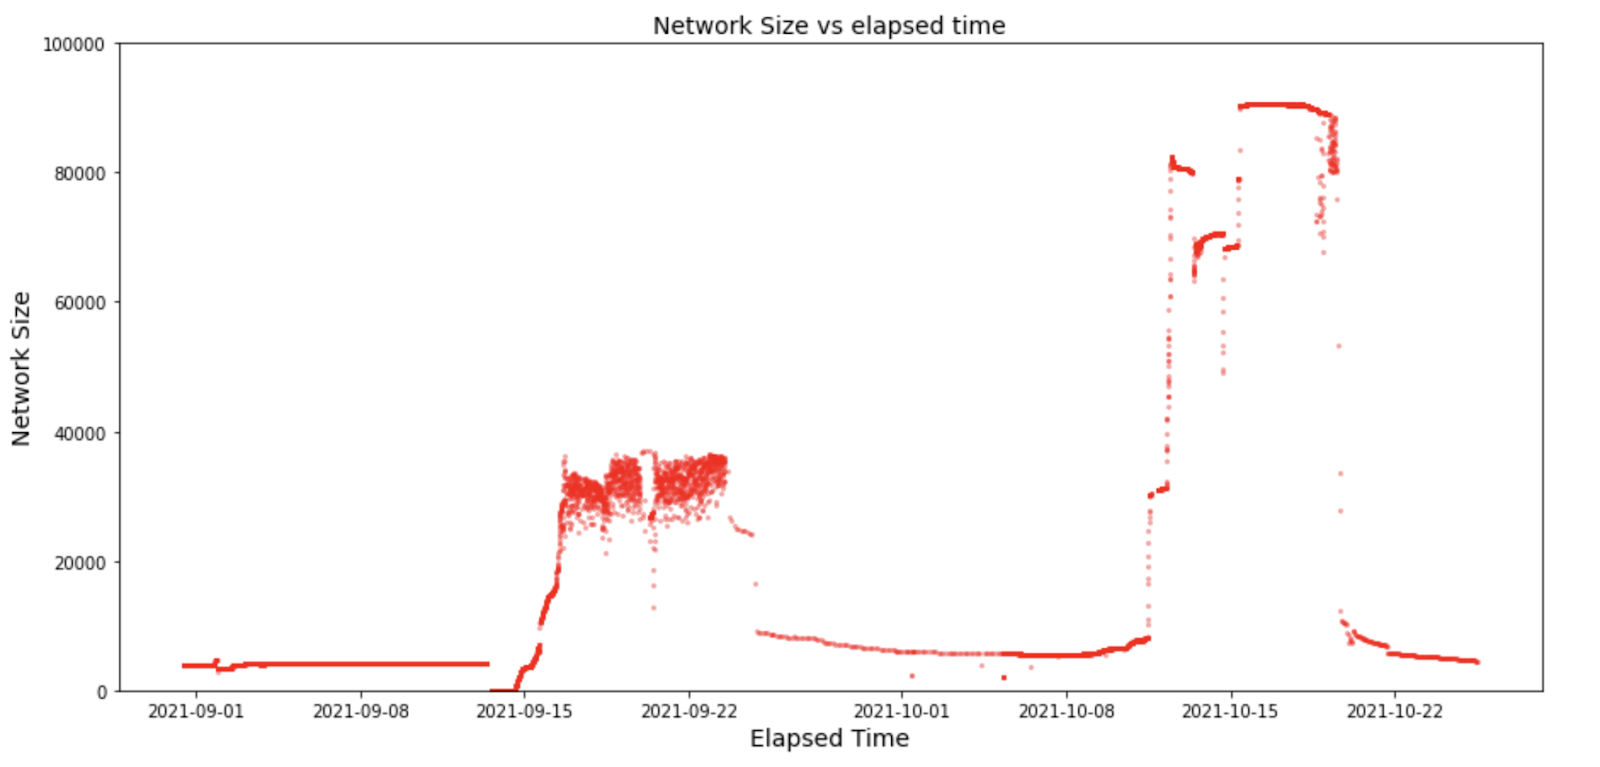
The graph shows the network size between the beginning of Testnet 1 and a few days after the end of Testnet 3. The data is based on the trackers view of the network. The node count limit set for Testnet 1 is visible during the first 2 weeks. In Testnet 2, when the cap was increased there was a rapid increase in the number of nodes. However, the difficulties with the remaining centralised infrastructure is visible in the instability of the network size during Testnet 2 between the 16th and 23rd of September. Finally, during Testnet 3 between the 12th and 19th of October, after a few initial hiccups the cap on network size was removed and the number of nodes hit above 90k. Before the end of Testnet 3 there was a problem with one of the Trackers which did not affect the P2P connections or message propagation but can be detected as instability in the data.
By comparing the trackers’ and peers’ views of the network, it can be said that 99% of the nodes were able to form their target connections. This is very good news as it means that there were very few problems with connectivity across the network. Based on the gathered data for NAT types, a big contributing factor to this is that UDP blocking NATs were not present and Symmetric NATs were only found on 0.1% of the participating nodes. Furthermore, analysis of known IP addresses showed that ~85% percent of the nodes in Testnet 3 were run inside cloud provided instances across different data centres all over the world. The internet infrastructure of cloud providers is of high quality, which has likely contributed to the P2P network’s good connectivity. Data from the round-trip time (RTT) measurements of the P2P connections also showed that over 20% of connections had two-way latencies of below 1ms. This indicates that lots of connections were formed between nodes in the same data centres or between nearby data centres.
To display the rate of published reward codes being claimed, the following figure shows the number of claims and the network size in the network during the peak. The claim rate is well above 99%, which shows that the small minority of the four types of outlier nodes were consistently unable to claim the rewards.
Latency
Accurate message propagation delay measurements are quite difficult, if not impossible, to achieve in a decentralized public network. As previously described, the network’s delay was measured using the published reward codes and their associated claim requests.
The latency related figures presented here represent Testnet 3 datasets that have been cleaned of faulty outlier data, but none of the values have been altered for error correction. However, there are corrections that could be included to the latency measurements. These potential corrections are based on detected static or average noise present in the data and are mostly attributable to high load on the miner-backend server. Overall, the detected noise appears to double the values of the latency measurements.
To get an idea of what is the unicast delay from the publisher to all subscribers in the network, all nodes would send “ping-pong” HTTPS-requests to the miner-backend. Although an HTTPS request’s overall latency is not directly comparable to that of the WebRTC connections used by the nodes, it can be used to get a good estimate. An HTTPS request should take between 1-3x longer than sending a message directly over a completed WebRTC Data Channel. By selecting a sample of nodes that have reported WebRTC latency measurements, it is possible to get an estimate of how much longer the HTTPS requests would take. For both protocols, the minimum value reported by nodes was selected and a mean of those values was calculated.
The calculation showed that the HTTPS measurements took almost exactly 2 times longer. Previous experiments have shown that a WebRTC connection’s RTT is almost directly comparable to a similar value measured by a Unix ping-command. With these assumptions, it is possible to calculate the mean underlay delays from the publisher to all subscribers. The mean of the minimum measurements was 198ms in Testnet 3’s at a network size of 80,000. The mean one way delay can be calculated from this value by dividing it by two twice, which yields a result of 49.5 ms.
The other key metric to calculate the RDP of the network is the MMPD. The MMPD results for Testnet 3 are displayed in the following figure. The figure displays the total number of nodes in the network. However, as the reward stream was partitioned to 10 separate topologies it is important to note that the actual average stream size at peak was around 9,000.
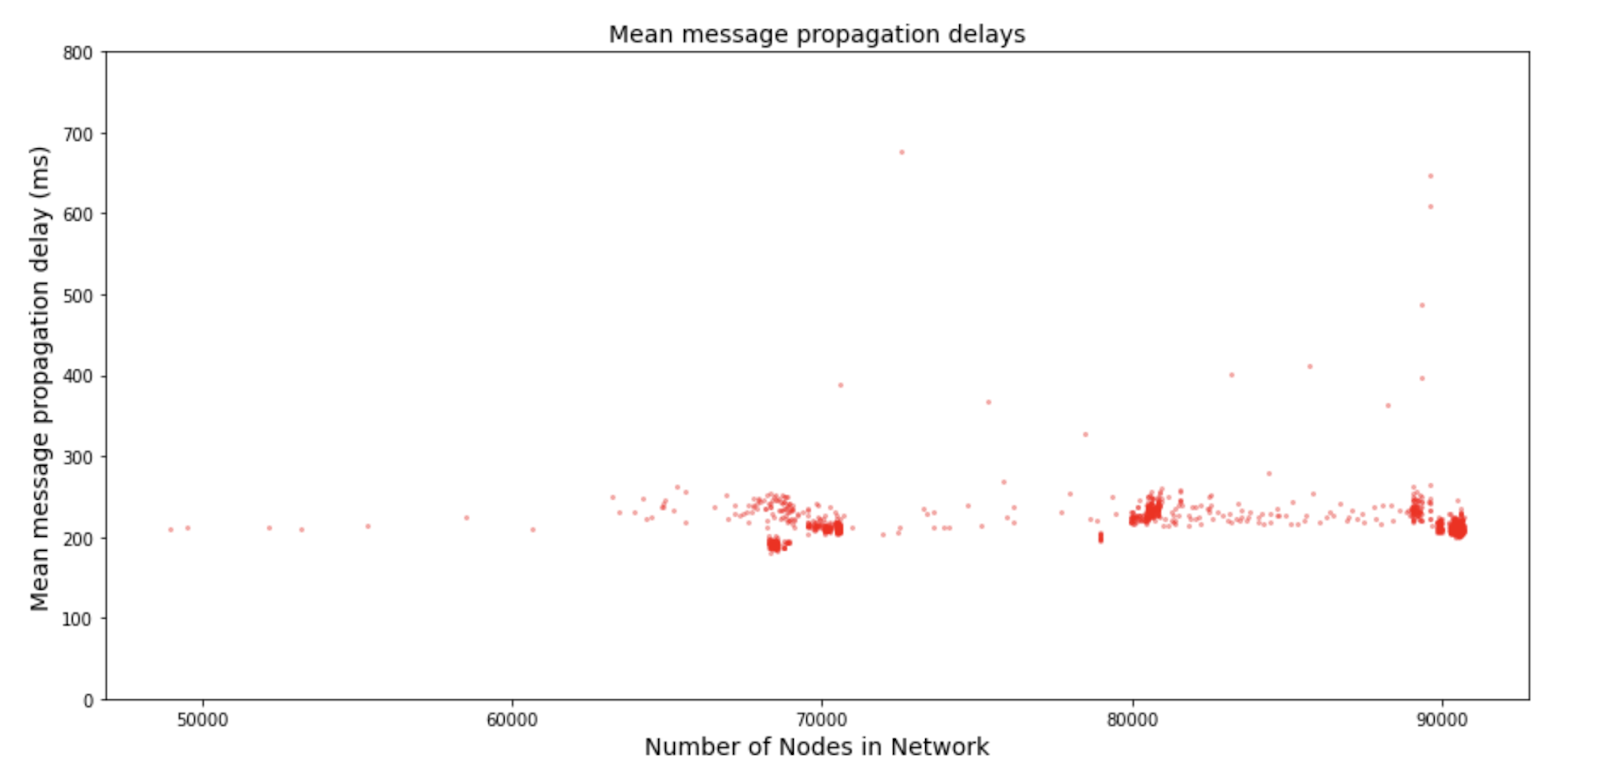
The figure shows that the MMPD remained quite stagnant even as the size of the network grew. This showcases that the Streamr Network scales logarithmically by design. There are a few outlier data points in the figure. For a better understanding of the outlier latencies during Testnet 3 the following figure shows the MMPDs over time.
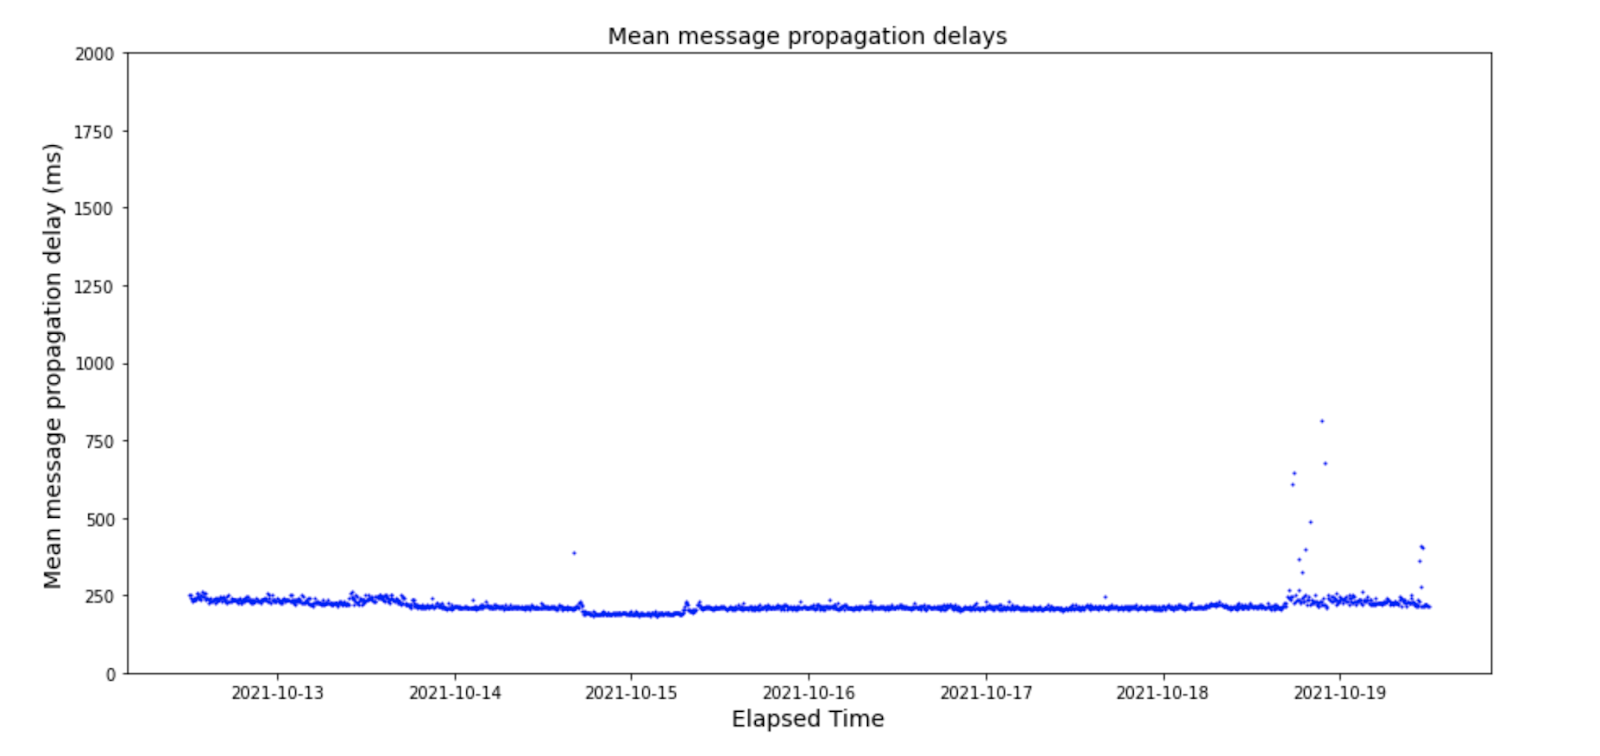
When comparing the MMPDs over time to the size of the network during Testnet 3, the MMPDs can be said to be very stable. There are a few points in the data where the latencies spike momentarily. These events occurred during the largest churn events of Testnet 3. The first spike seen towards the end of 14th coincides with a quickly solved problem in the network, after which nodes started to rejoin the network. Towards the tail end, there is another slightly more prominent cluster of spikes that can be attributed to another network problem that was also quickly resolved. The final set of spikes corresponds with the end of the incentivisation period of Testnet 3 concluded and miner-nodes started to rapidly leave the network. Overall, the streams remained stable in latency and rarely experienced noticeable spikes, even during churn.
As the mean underlay delay was measured at 49.5ms around 80,000 nodes and the mean message propagation delay is around 230ms at the same time window, the RDP of the streams is around 4.65 at 8k nodes. This is on par with previous research done on the performance of similar overlay network topologies. As the result is gained without error correcting any values, it is likely that any static increases in the latency measurements are corrected in the RDP calculation itself.
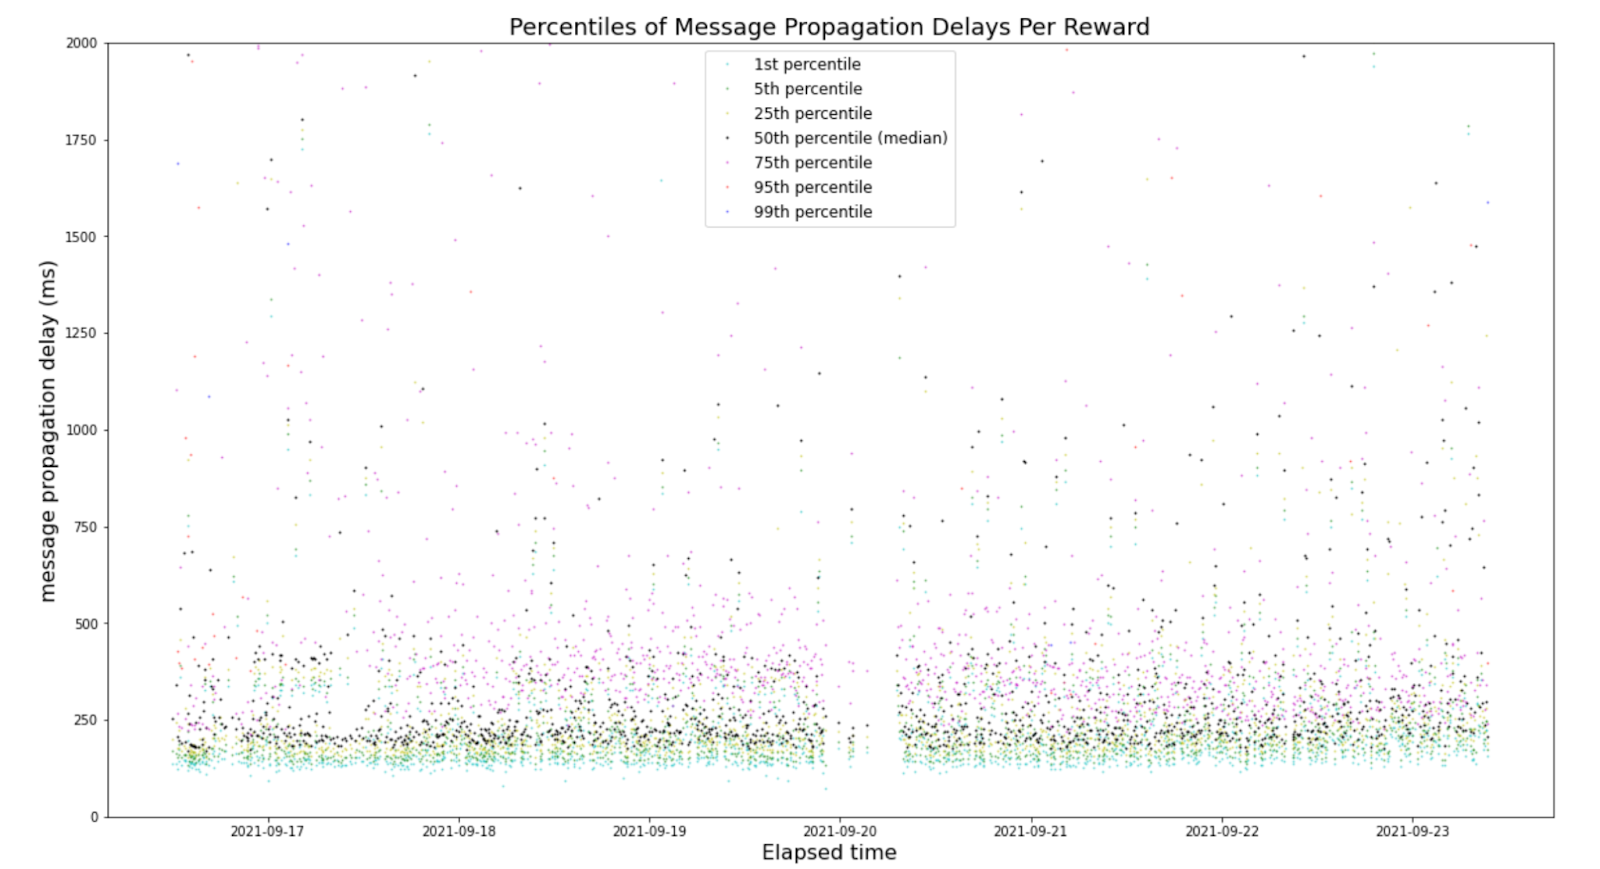
To better understand what the distribution of latencies in the network was during the peak, the following figure shows some key percentiles of the distribution. The key takeaway from the plot is that 95% of the nodes received the reward codes below 350ms, before error correction.
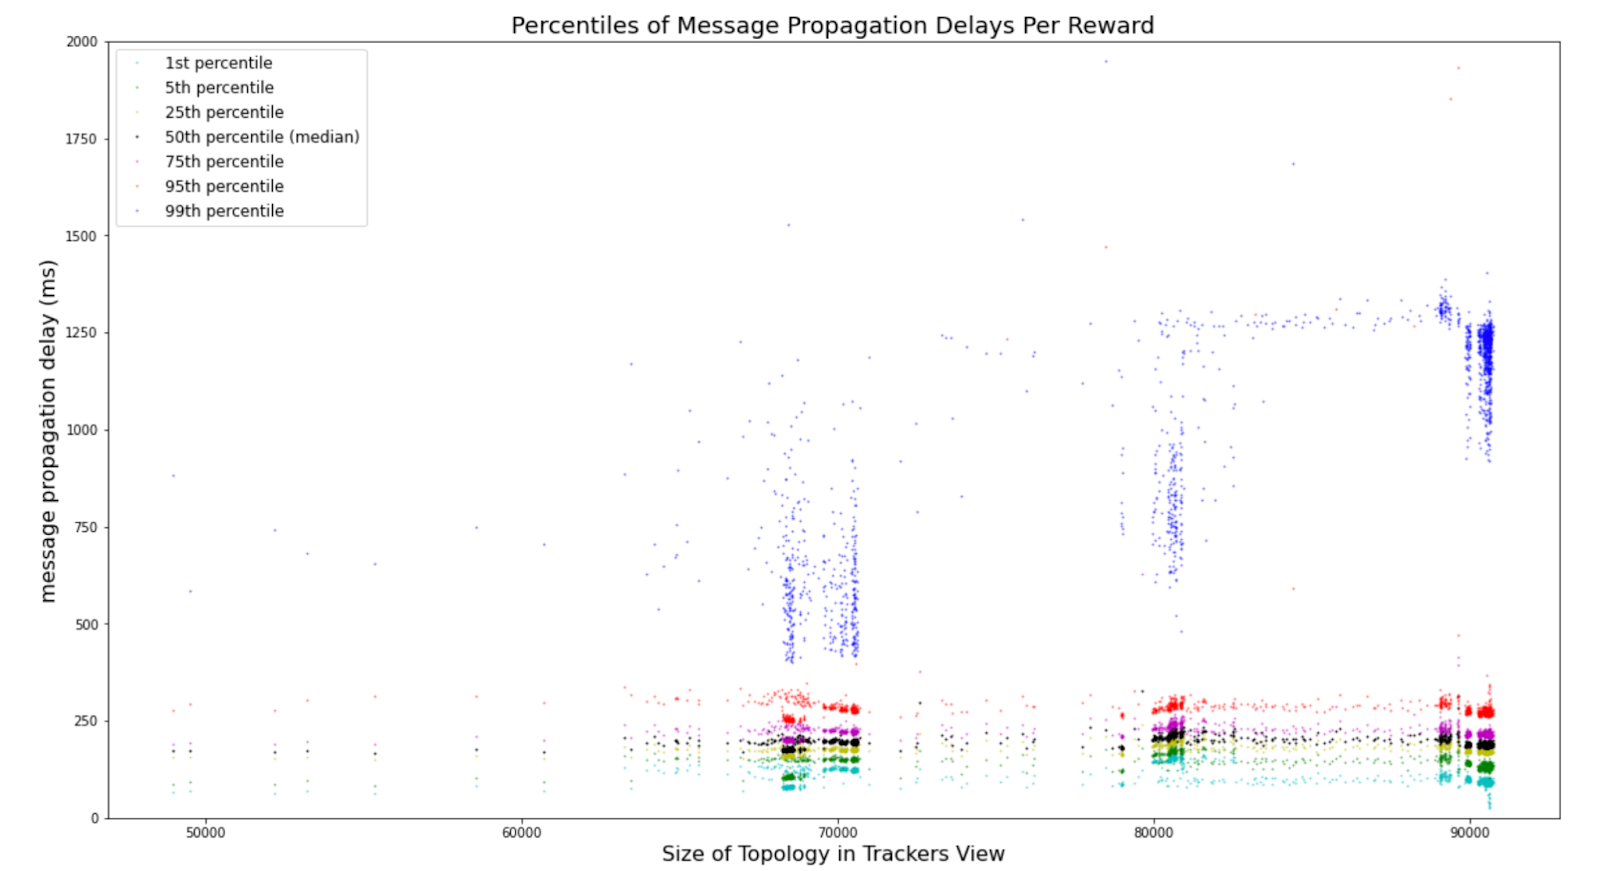
The plot shows that the MMPD is brought up by outlier nodes. This fact can be most clearly seen by comparing the 75% percentile to the mean latencies. The values match almost exactly with each other. This is very good news as it shows that the default number of connections per stream (node degree) of 4 yields stable low latency results in public setups. However, in the future, stream owners may increase the default node degree of their streams for further message delivery guarantees and lower latencies at the cost of bandwidth consumption. Further details can be found in the Network Whitepaper.
Topology analysis, MMPD overhead
The results of analysis on the stream topologies yield very interesting results. As mentioned previously, measurements for MMPDs had errors that could have doubled the values. This becomes more apparent by running Dijkstra’s algorithm through the reported network topologies. The peer view based Dijkstra calculated expected MMDPs for one of the reward streams during Testnet 3 are presented in the following figure.
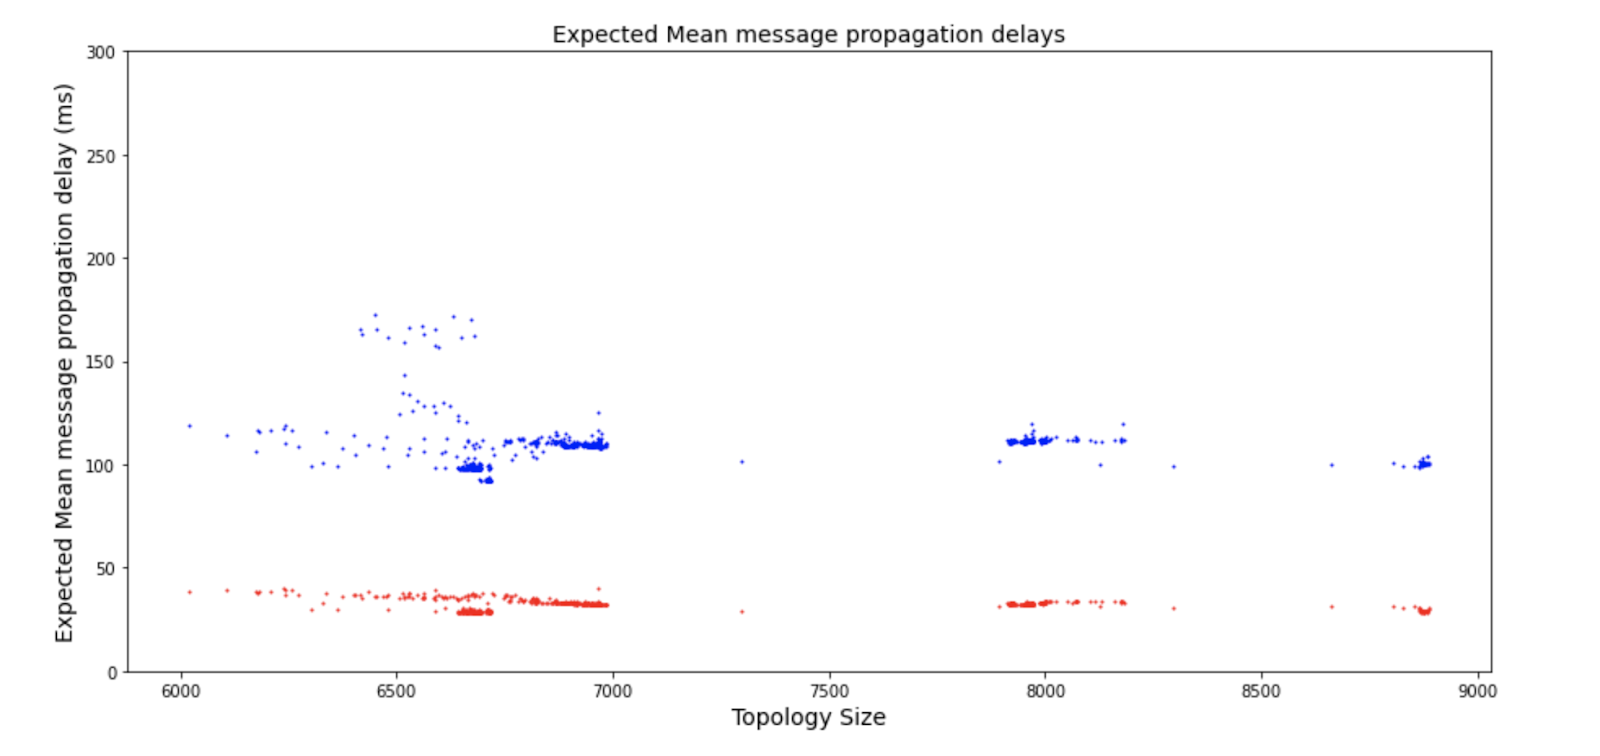
To trace back if the real world measurements have detectable increases in the delays, the results of Dijkstra’s algorithm were compared to the reported delays of the miner-nodes along the same paths. The results of this analysis showed that there are noticeable static increases in the delays, which can be attributed to high HTTP-server load. Furthermore, previous research utilising more controlled and accurate measurements has shown that the difference between the Dijkstra calculated and actual MMPDs on average is 1.24%. This value is nowhere near the almost 2x increase that is seen based on the real world MMPD measurements.
During Testnet 3 the miner-backend server was periodically experiencing the load of 60,000 to 90,000 nodes sending POST requests in a relatively short period of time. Thus, the increase in the measured real-world latencies is reasonable with the used methodologies. Furthermore, the miner-backend was moved to a more powerful machine between Testnet 2 and Testnet 3. Based on the data, the results of the latency measurements significantly improved after the server transfer. The important takeaway from the Dijkstra measurements is that the MMPD in Testnet 3 in reality should be much closer to 100ms than 200ms after error correction. Similar reductions would naturally apply to the distribution of latencies. Such a low global latency estimate makes sense given that the vast majority of nodes were running in cloud provided instances.
Implications of the results and Lessons learned
The results and turnout of the Brubeck Testnets are outstanding as the first publicly available version of the Streamr Network. The network was shown to have a low global latency with a low node degree of 4. This is very important as the constant bandwidth consumption set by the node degree is one of the key design points of the network’s scalability. Put shortly, a centralised publisher would have to publish messages to 9,000 subscribers individually, whereas a Streamr Network node broadcasts the message to only 4 connections. Similarly, a subscriber interested in receiving stream data from thousands of publishers will only need 4 connections to do so. The reduction in bandwidth consumption and connection maintenance costs are quite apparent.
In the future, it is likely that miner-nodes can increase their connection numbers for a price without requiring the rest of the nodes to do so. Stable nodes with many connections are beneficial to the rest of the network. However, they may end up being central points of failure that significantly reduce the stream’s performance during any potential downtime.
The massive turnout for the Brubeck Testnets set to stone the importance of full decentralization for the Streamr Network. Our remaining centralised infrastructure was simply unable to withstand the load of tens of thousands of nodes participating in the network. Luckily, before the launch of the Mainnet Brubeck, one of the largest remaining centralised parts of the Streamr Network, the stream registry will be moved on chain. This means that the Brubeck Mainnet will be further decentralized than the network version used in the testnet.
Summary
Overall, the Brubeck Testnet has been a huge success! We got the chance to truly battle test the technology and are grateful for the community that made this possible! Lots of issues were detected, traced and fixed, resulting in a P2P network with over 90,000 participating nodes. The scalability and performance of the Streamr Network has been proved to be state-of-the art.
The Brubeck Testnet’s incentivisation periods were officially concluded on the 19th of October 2021. The public testnet has still remained open for the past month and users may still run nodes. Developers can already leverage the decentralized publish-subscribe network to build applications that do not need traditional centralised messaging infrastructure.
The Testnet rewards are now distributed over the Polygon Network. With an added extra bit of MATIC for you to move your DATA. Next, we are looking forward to the release of the Brubeck Mainnet after which development towards the Tatum milestone will begin.